
Read backtest charts and sensitivity scenarios
Read NAV, drawdowns, execution markers, fees and execution-delay sensitivity with the correct assumptions.
Reading results: jQuantStats and the price/execution chart
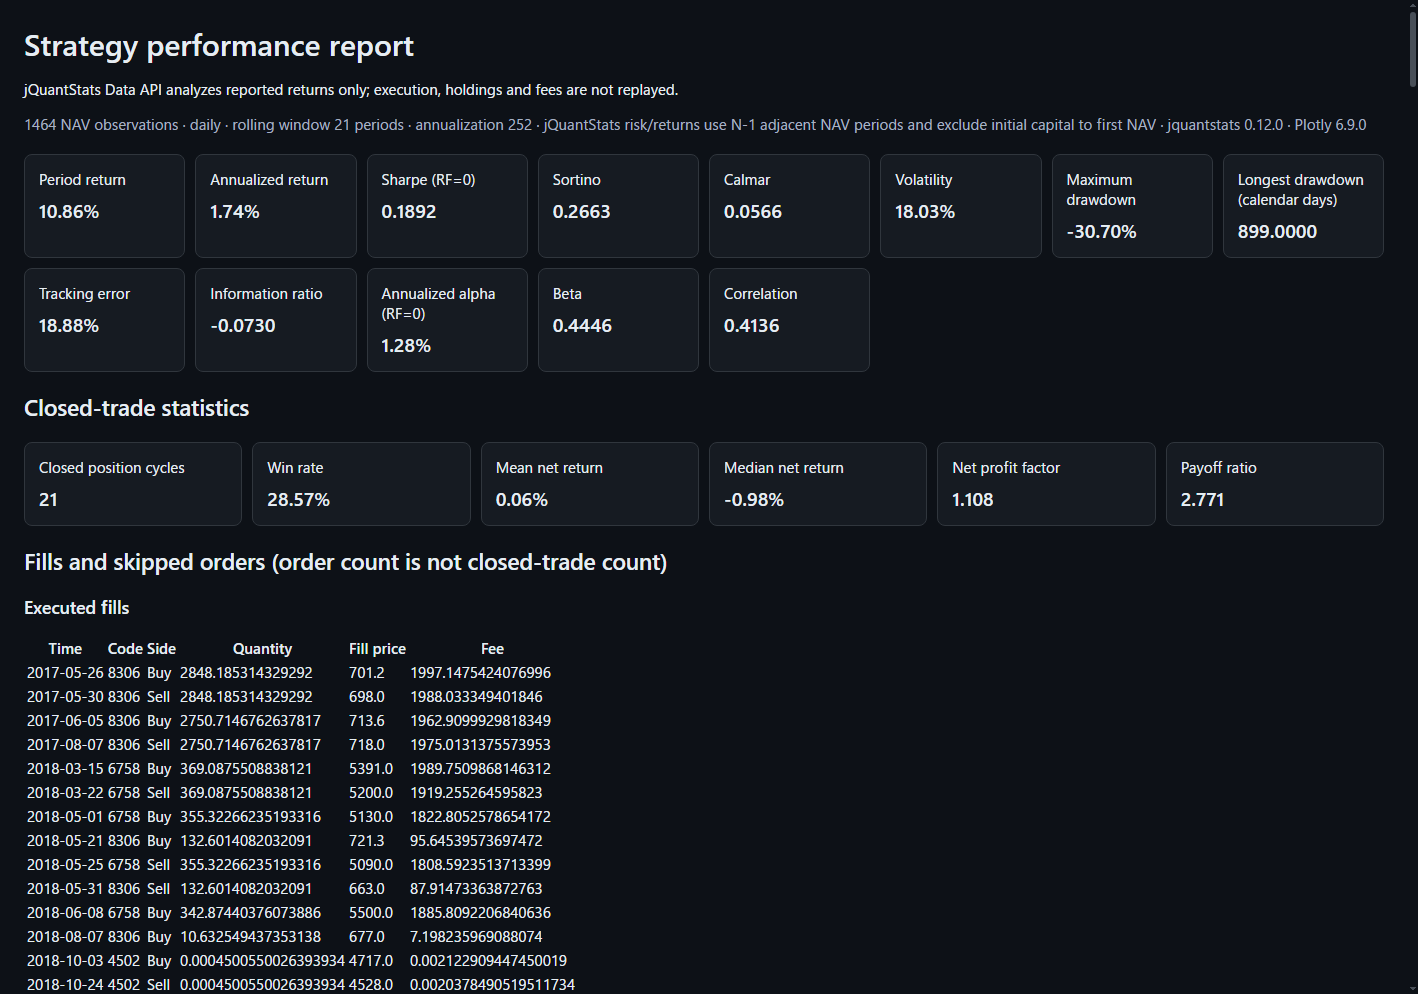
First confirm report model, sampling frequency, dates, price basis, fees, TOPIX source, and pit_guarantee=false. jQuantStats analyzes N−1 adjacent NAV return intervals and excludes initial capital to the first NAV. Native NAV and whole-window return use the source report’s initial-capital basis; do not mix the denominators.
Daily annualization uses 252 periods only when the report declares daily; irregular observed dates are not a verified JPX calendar.
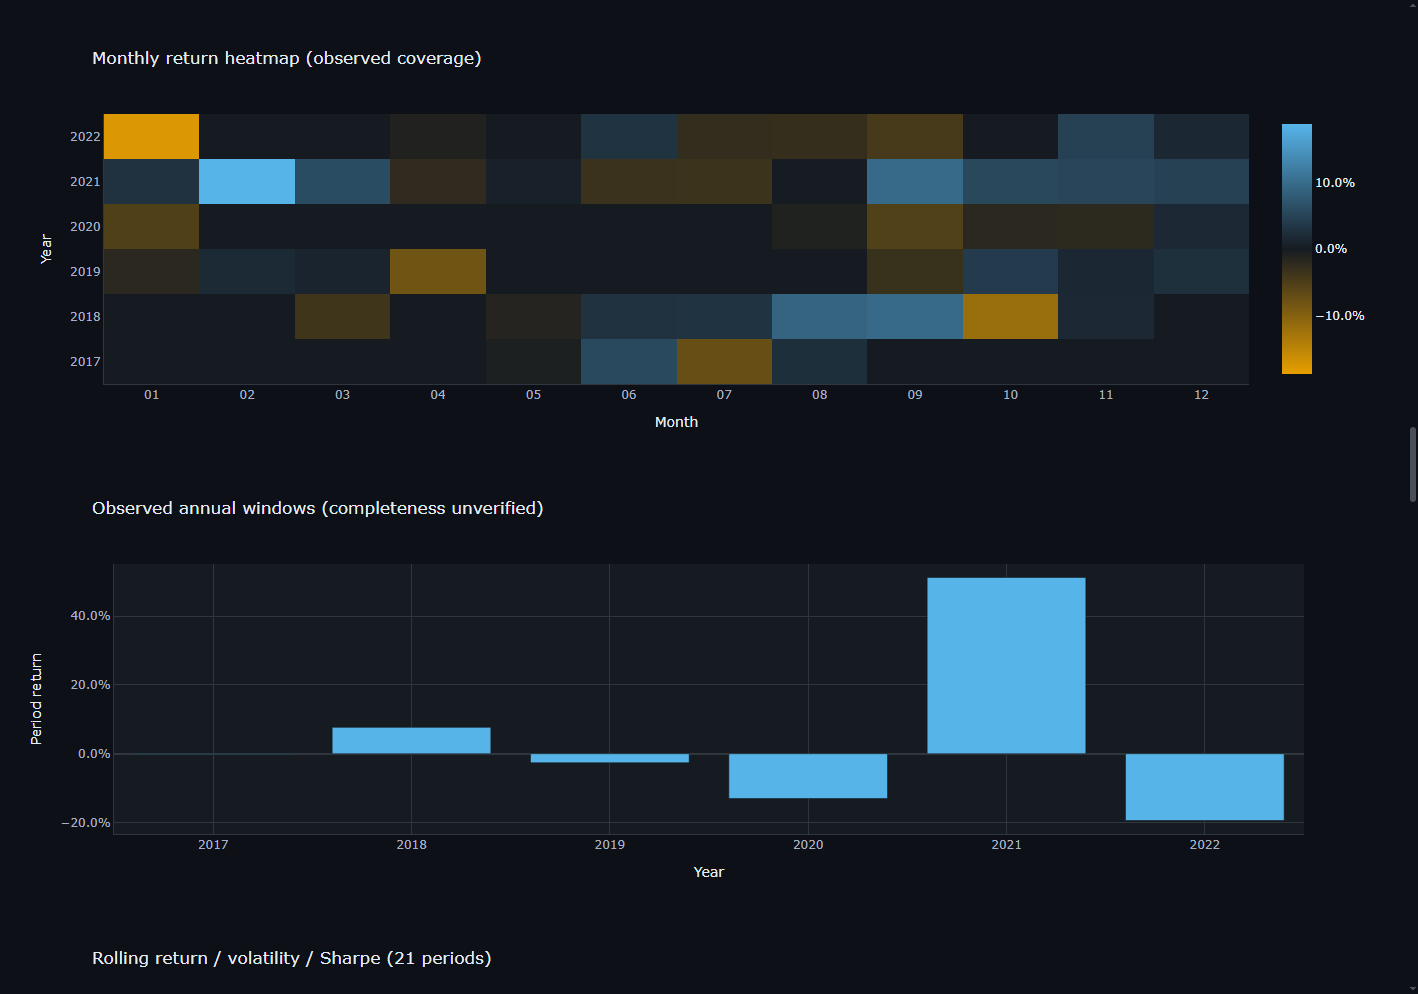
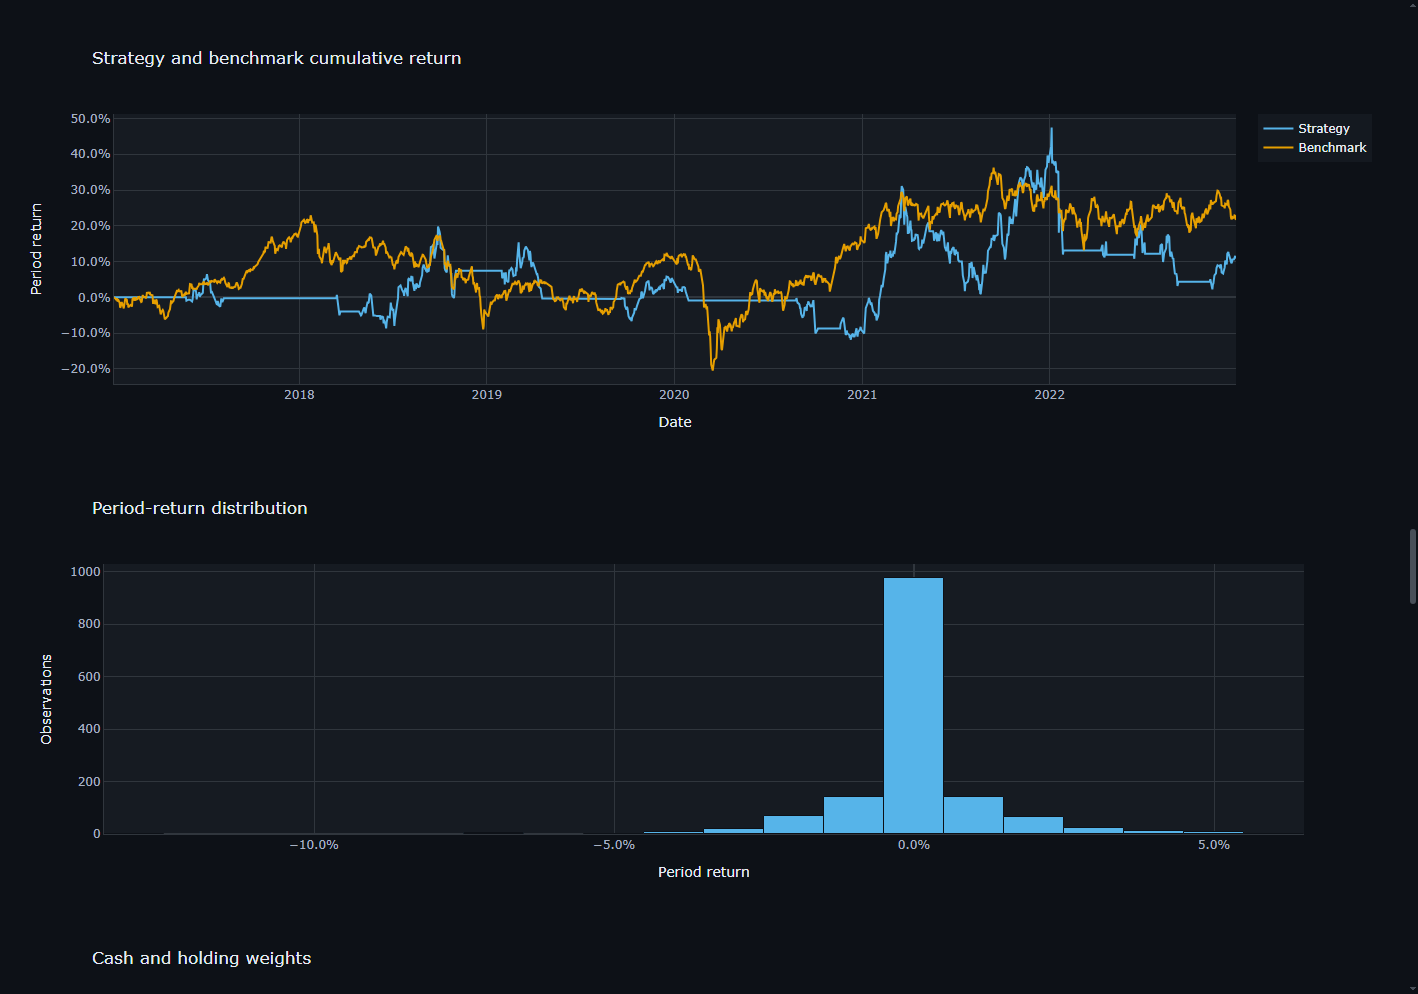
The dashboard presents 15 overview groups in order: jQuantStats adjacent-NAV return snapshot; source-report NAV; underwater drawdown; monthly-return heatmap; observed annual windows; rolling return/volatility/Sharpe; strategy-versus-TOPIX cumulative return; period-return distribution; cash/holding weights; FIFO closed-trade returns net of fees; cumulative realized P&L; cumulative actual fees; gross two-sided turnover; holdings count/maximum weight/HHI; and verified security-price contribution.
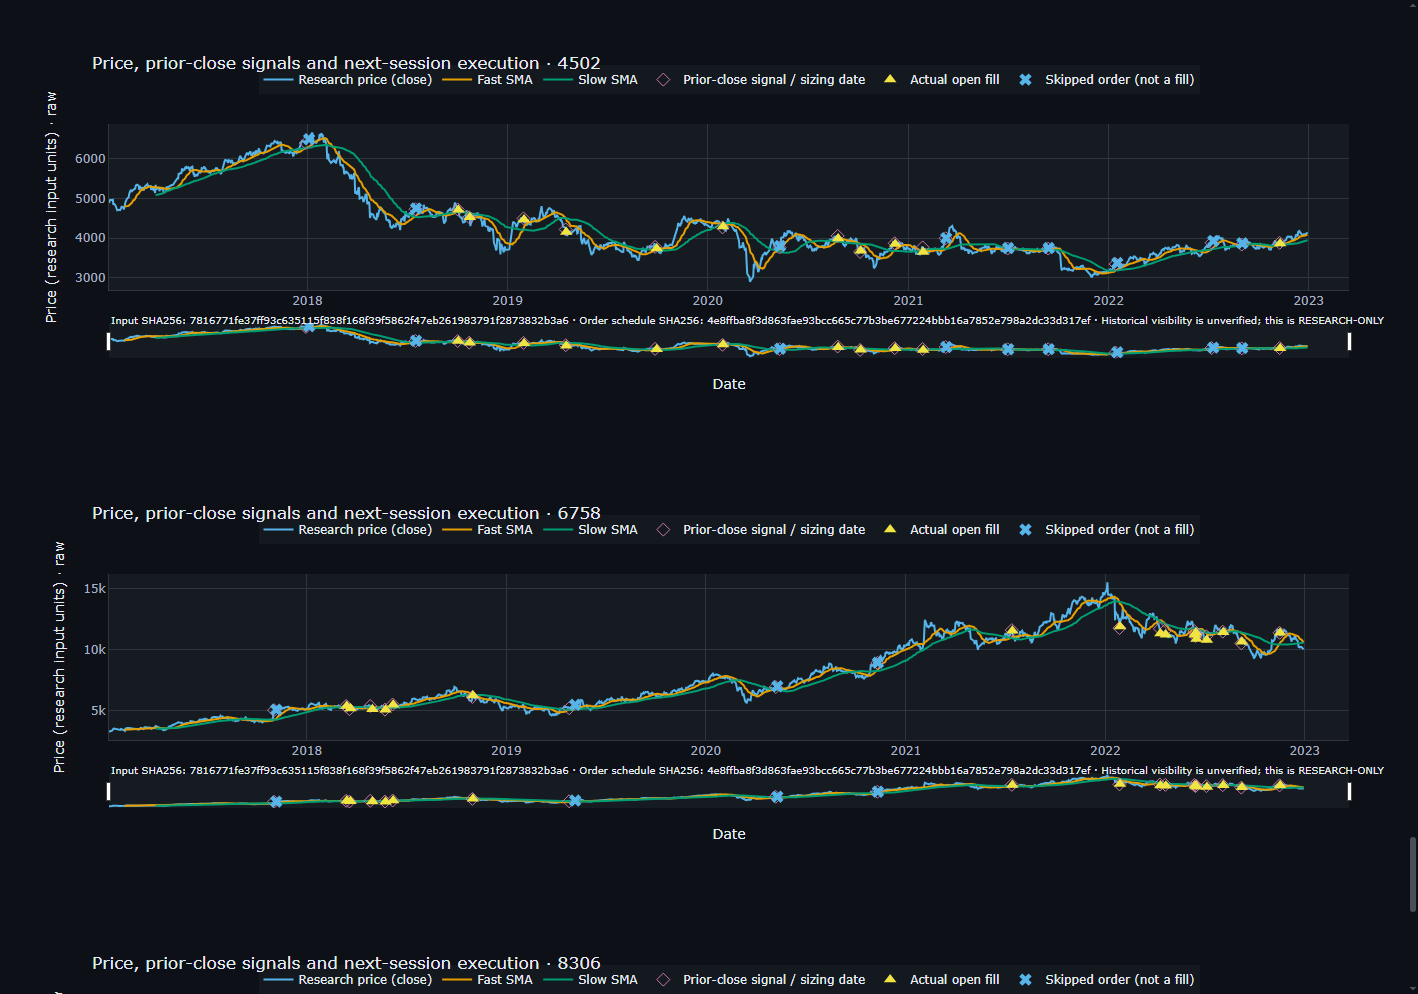
Per-security price diagnostics follow, plus a Regime panel. In this report it is Off/unavailable with zero traces; another report must contain qualified historical inputs to show a populated timeline. Annual plots show observed windows, not necessarily complete calendar years.
jQuantStats uses N−1 adjacent NAV intervals and excludes initial capital to first NAV. 252-period daily annualization applies only when the report declares daily. Hover for date, value, unit, axis, and missing intervals. Order, fill, and completed position-cycle counts differ.
Read the separate price/execution figure as raw price/indicator, prior-close scheduled order, actual open fill, and skipped order. Signal date precedes execution date; fill price is the open, not the signal price. TOPIX is a price index without dividends, not total return.
Do not deduct recorded fees twice. Gross turnover includes both buy and sell notional; it is not one-way turnover. Orders, fills, and completed position cycles are distinct counts.
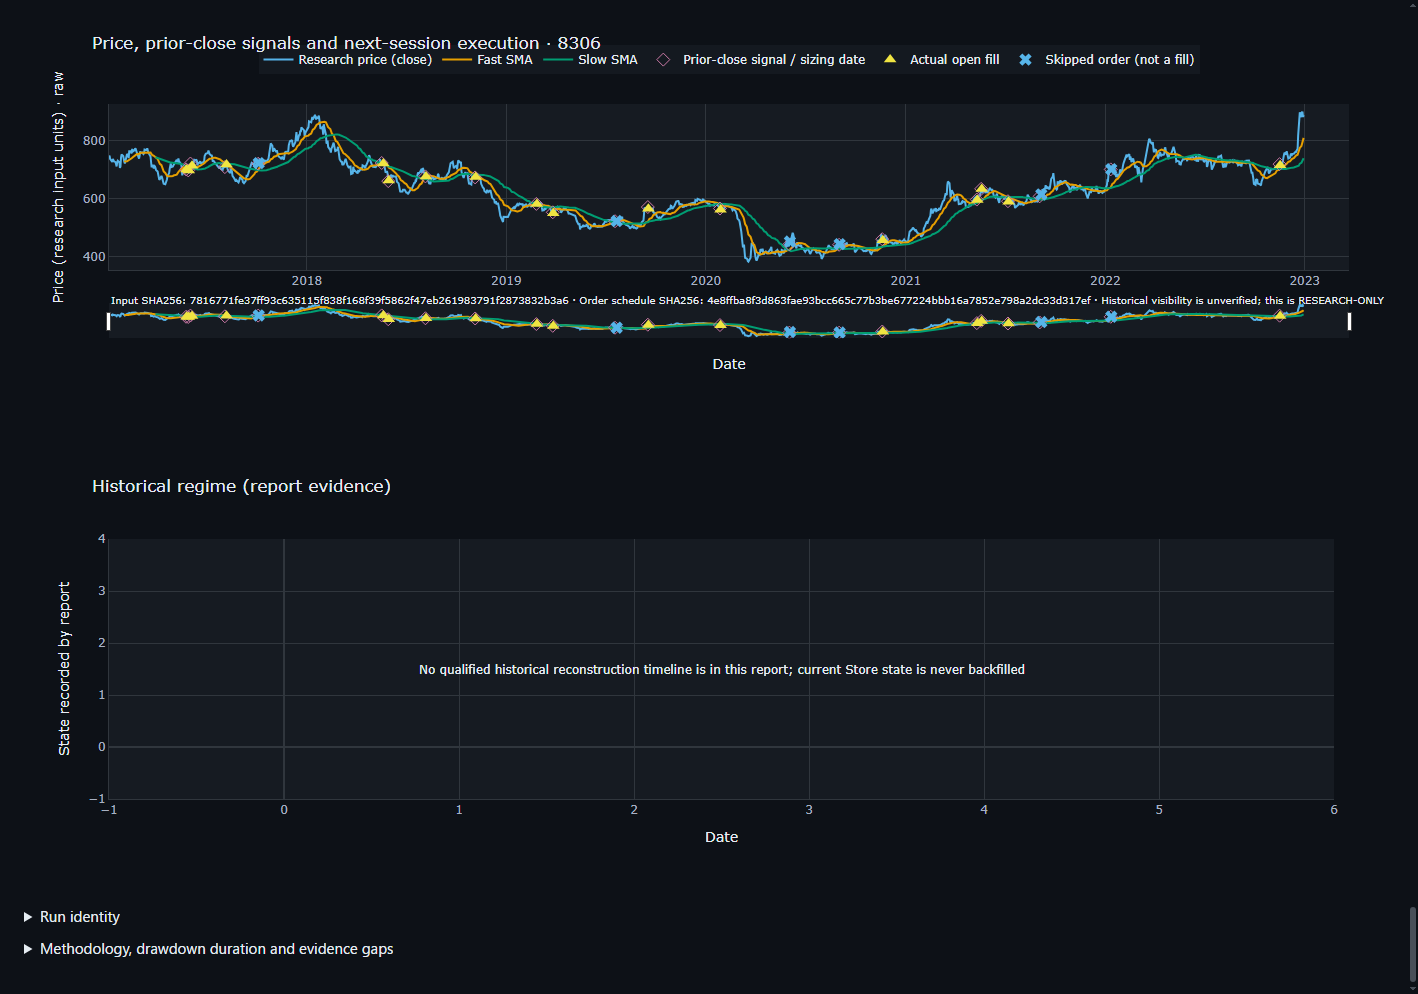
Links to all 19 images: 01 jQuantStats · 02 NAV · 03 drawdown · 04 monthly · 05 observed annual windows · 06 rolling risk · 07 TOPIX · 08 return distribution · 09 holdings/cash · 10 closed-trade returns · 11 realized P&L · 12 fees · 13 gross turnover · 14 concentration · 15 price contribution · 16 4502 price/execution · 17 6758 price/execution · 18 8306 price/execution · 19 Regime Off/unavailable, zero traces


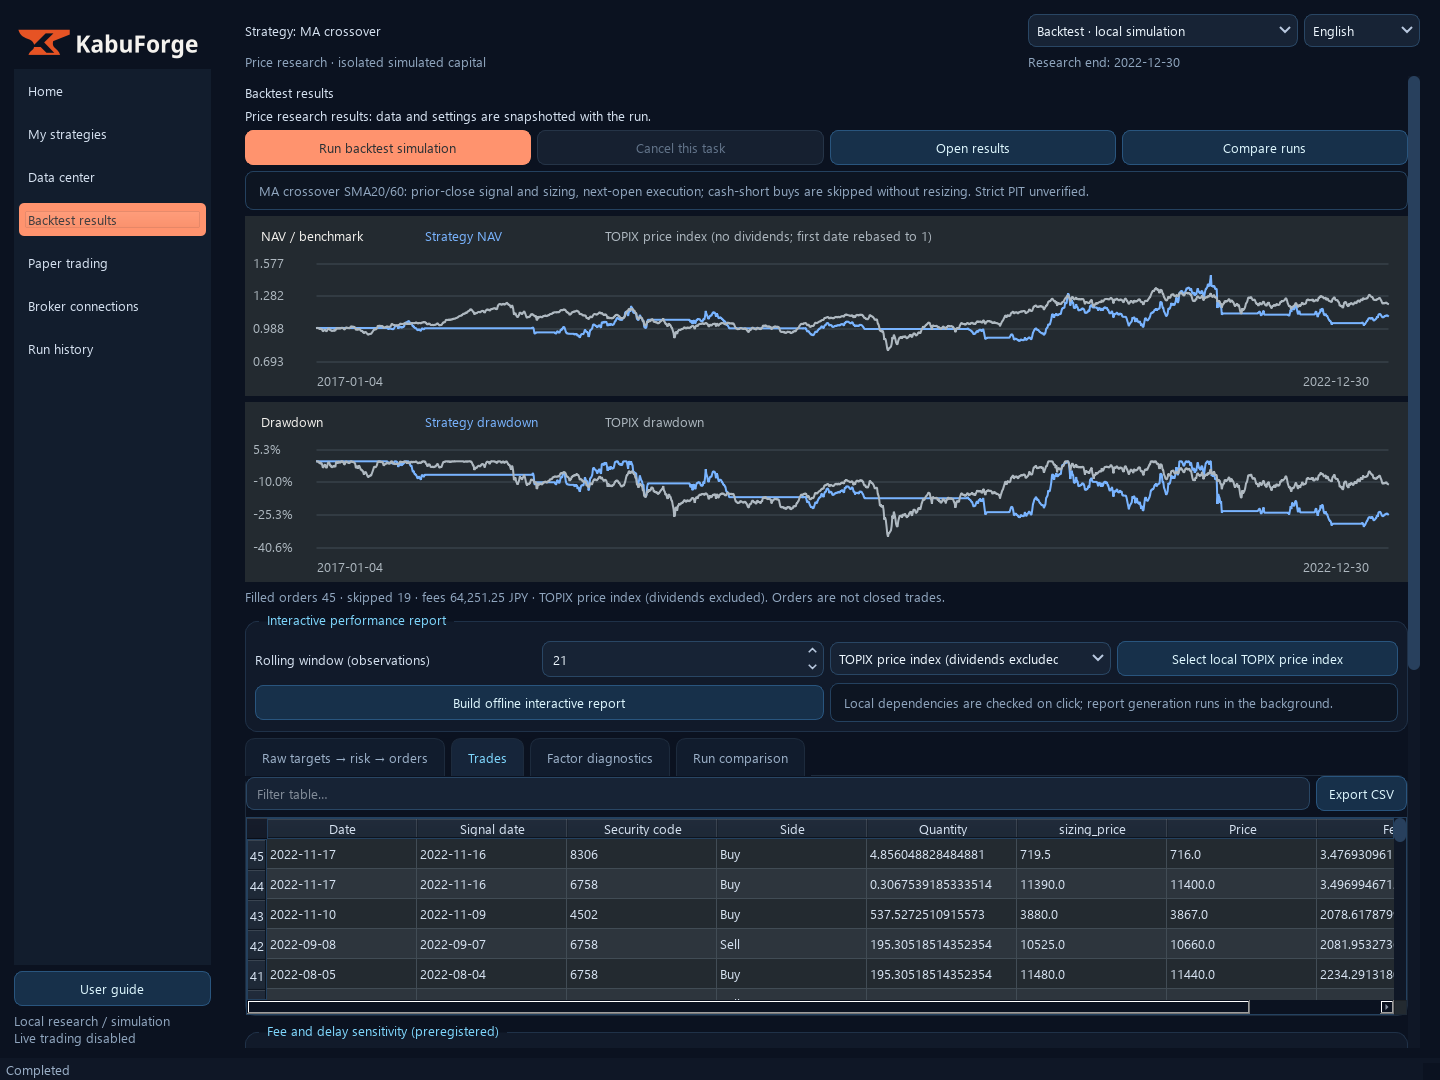
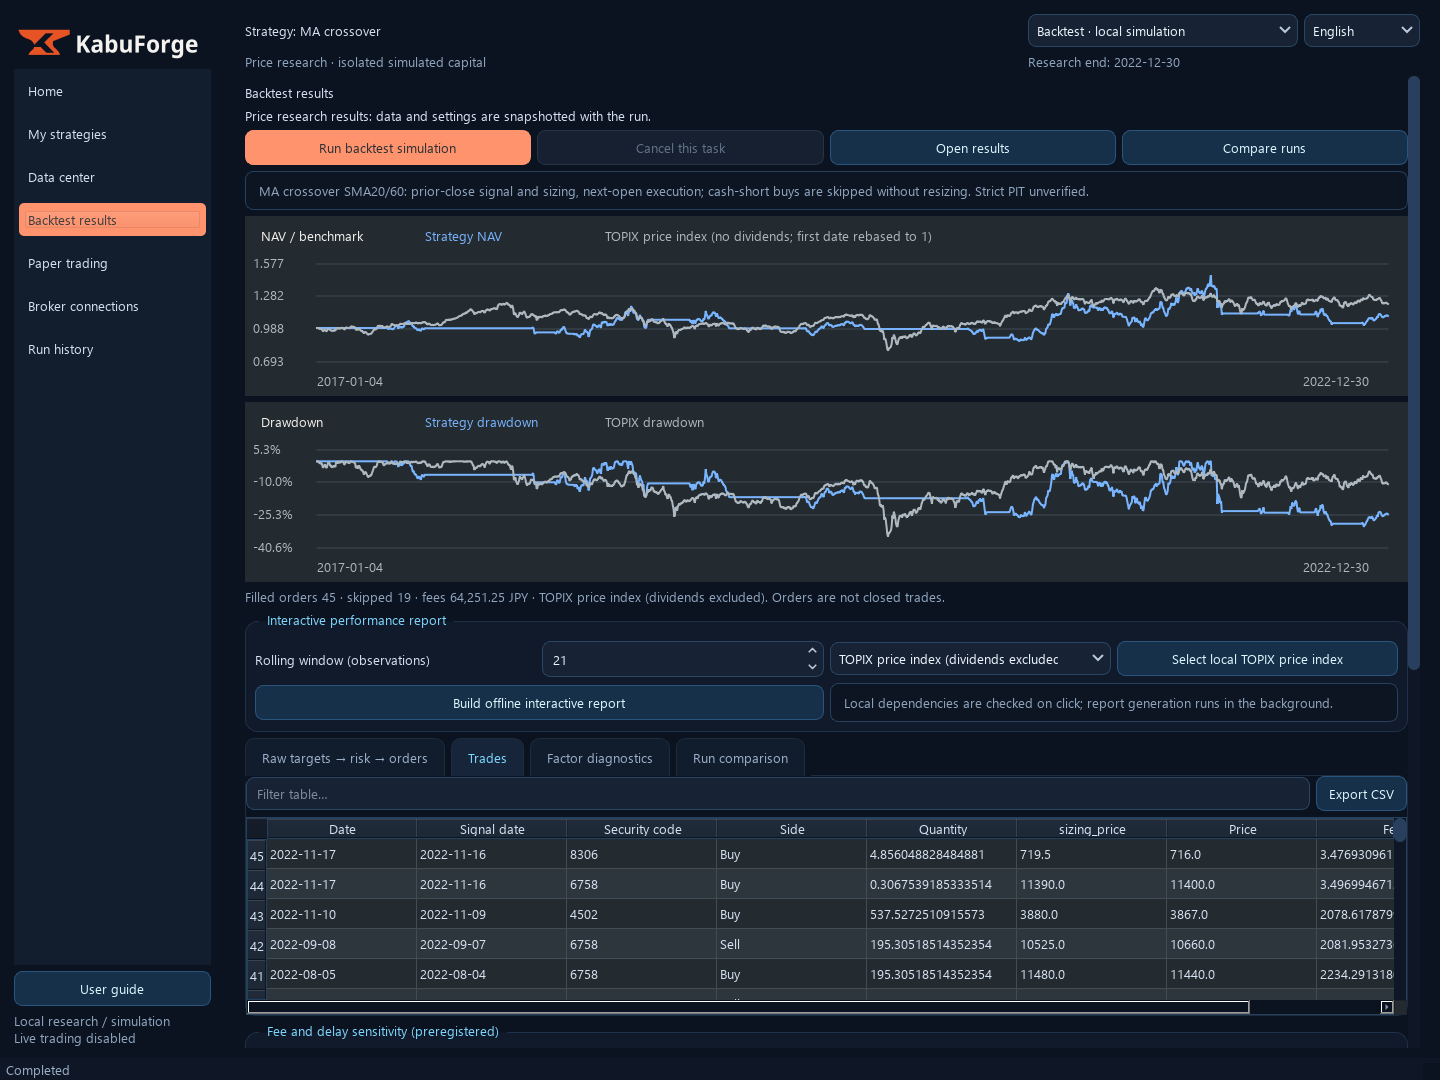
Concentration, contribution, and a populated Regime timeline appear only when supported by report evidence. This capture’s Regime panel is Off/unavailable with zero traces. Charts explain a run; they do not validate a strategy.
Fee and execution-delay sensitivity: bind a report and run all scenarios
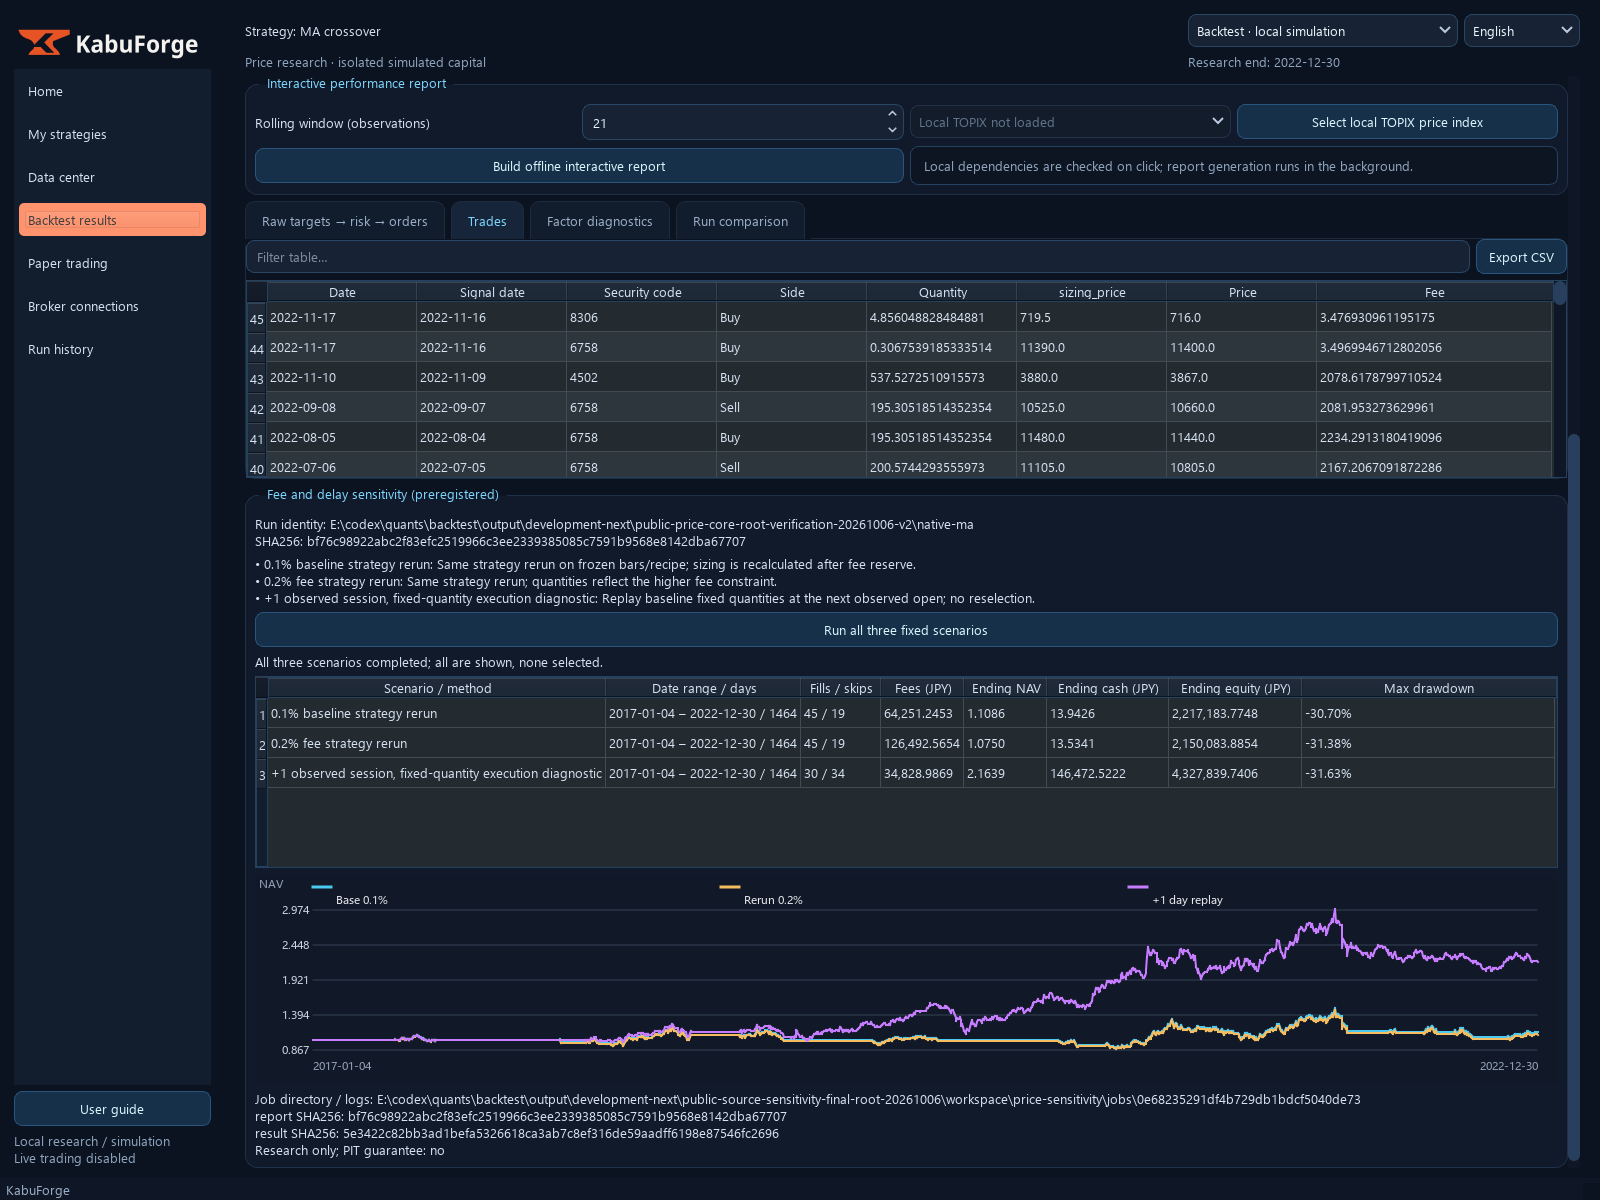
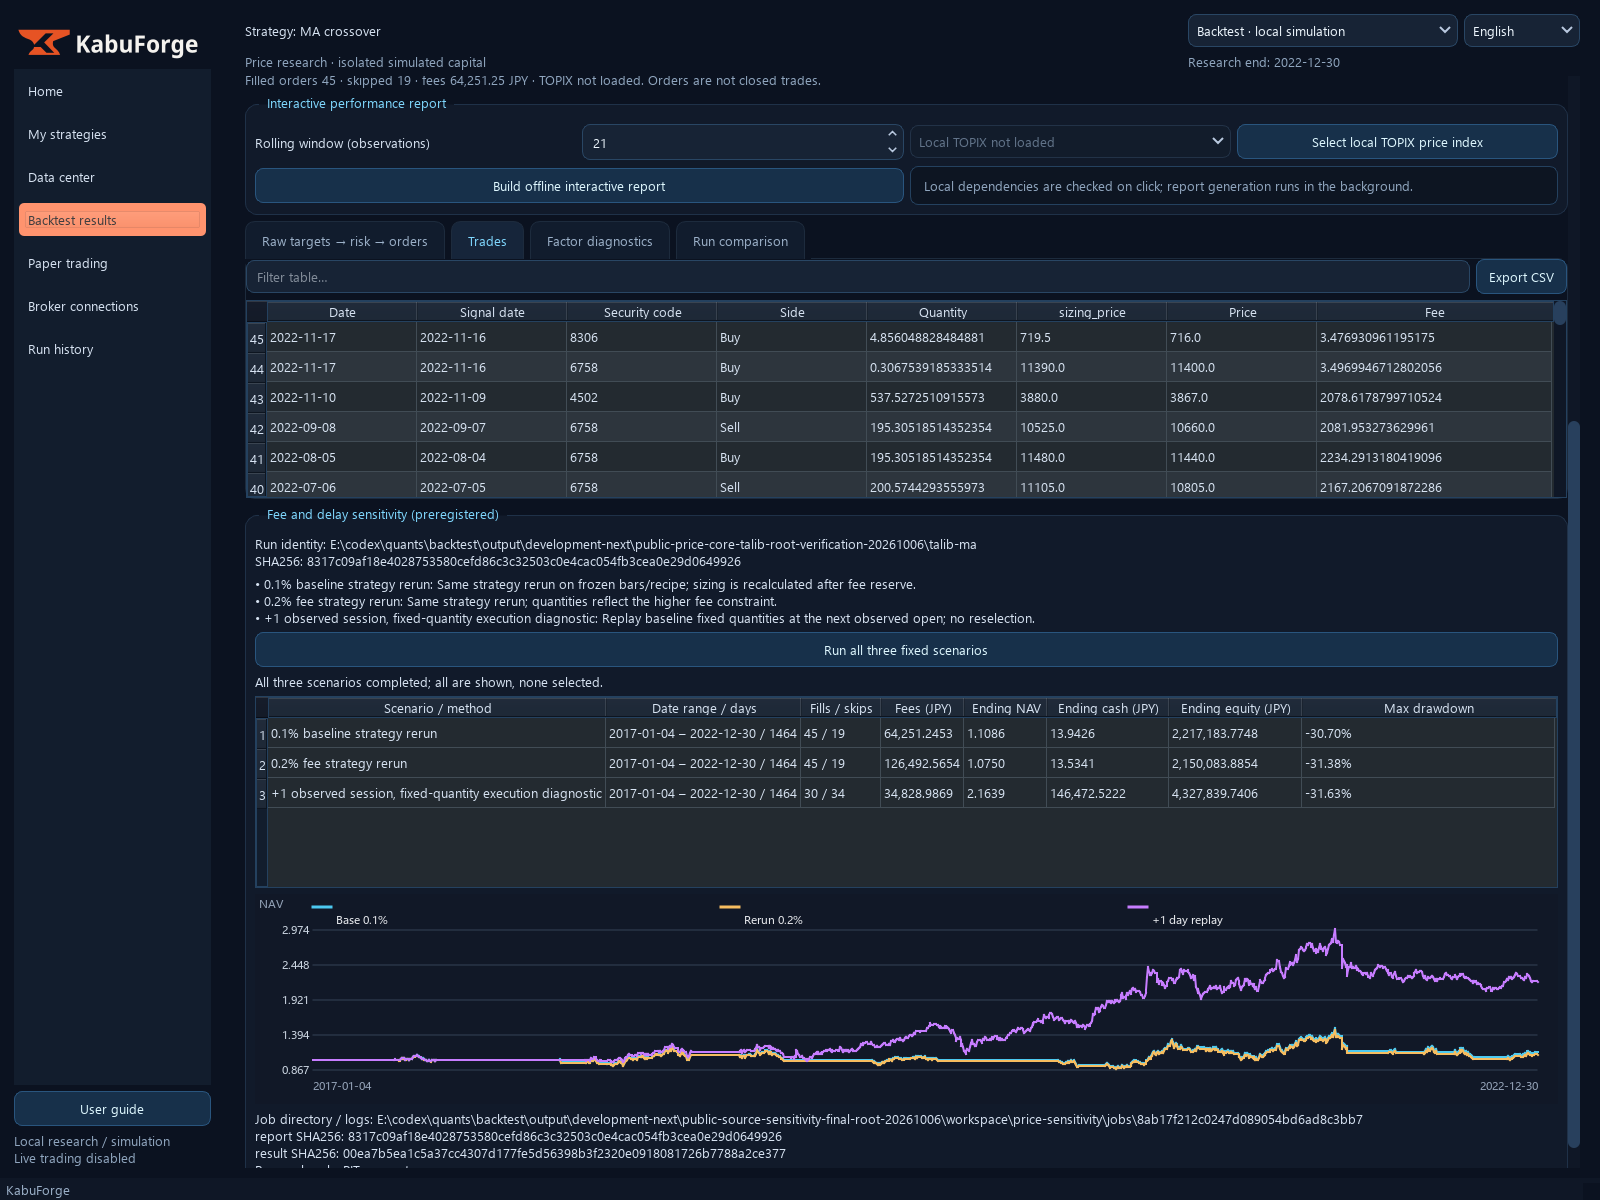
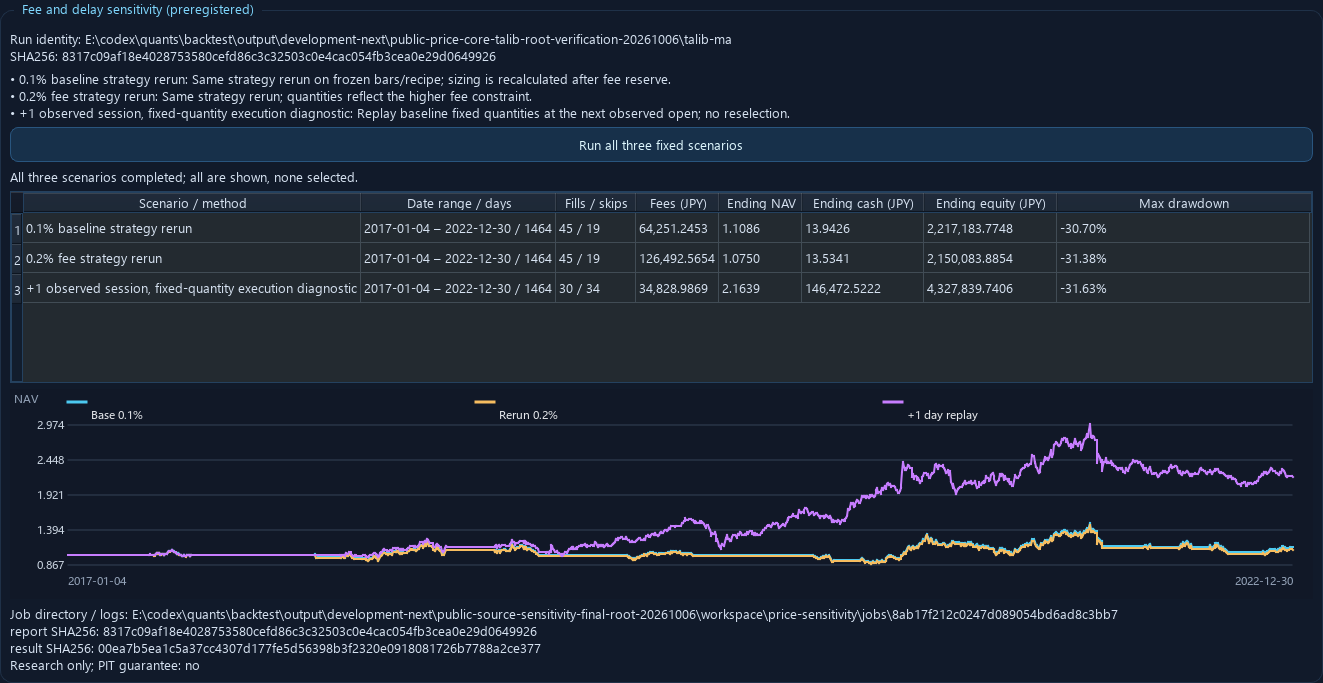
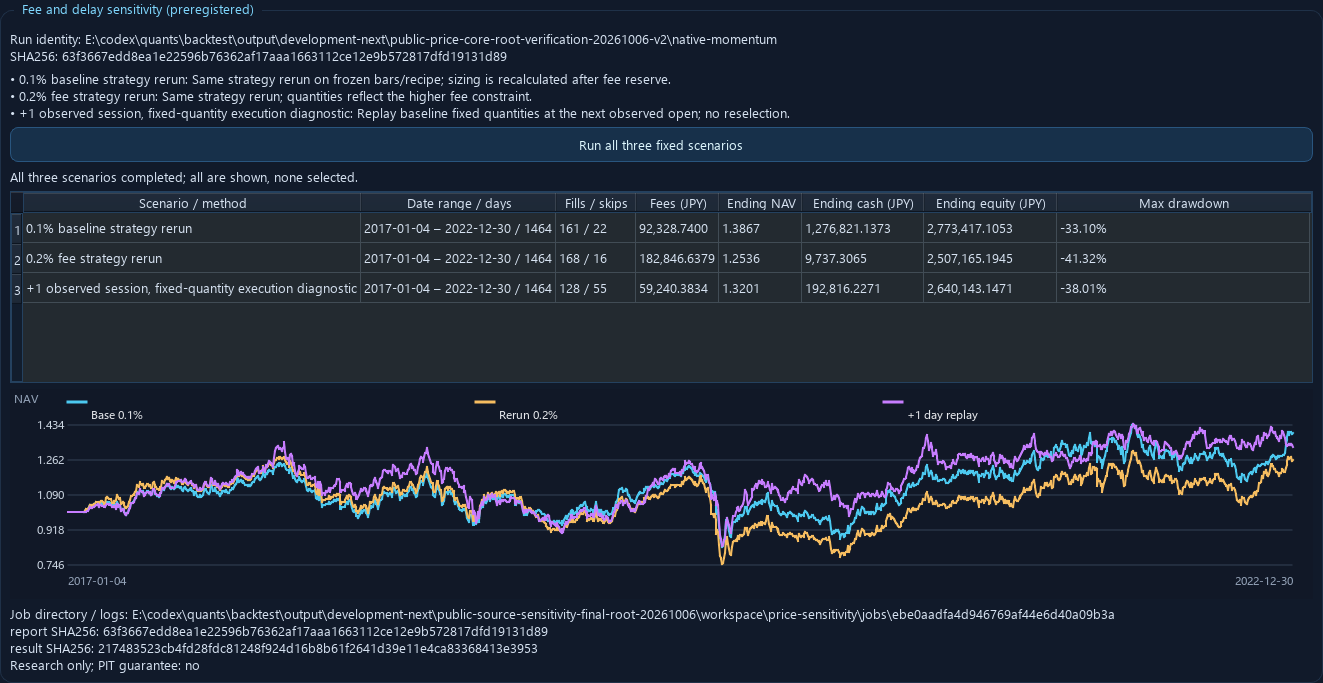
In “Backtest Results”, open a completed source report.json and confirm its strategy and input identity. Check that the sensitivity panel’s source path and SHA256 match the selected report, then click “Run all three fixed scenarios”. The fixed source report hashes are Native MA Native MA report (SHA bound locally), TA-Lib MA TA-Lib MA report (SHA bound locally), and price momentum price-momentum report (SHA bound locally).
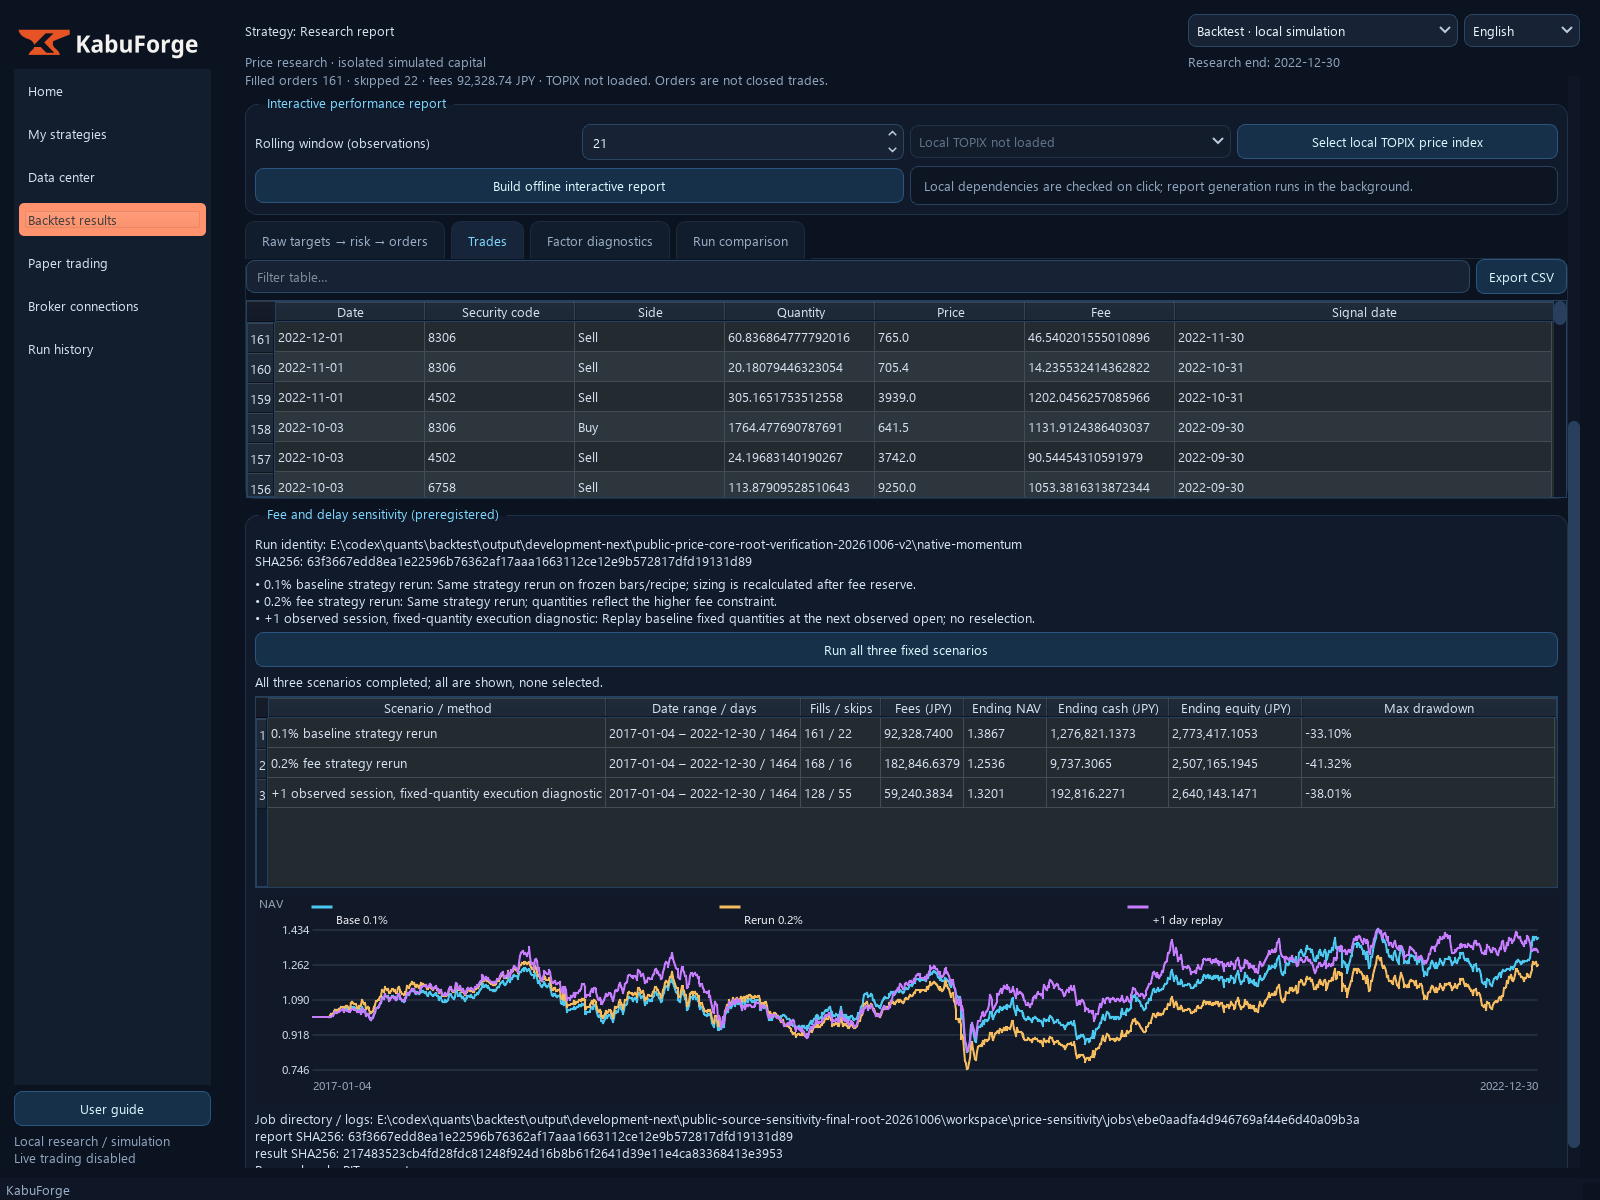
The momentum source is a root-prepared offline research report, not a GUI-created run receipt. The report bytes remain unchanged. Switching the interface language redraws the existing output and does not rerun it.
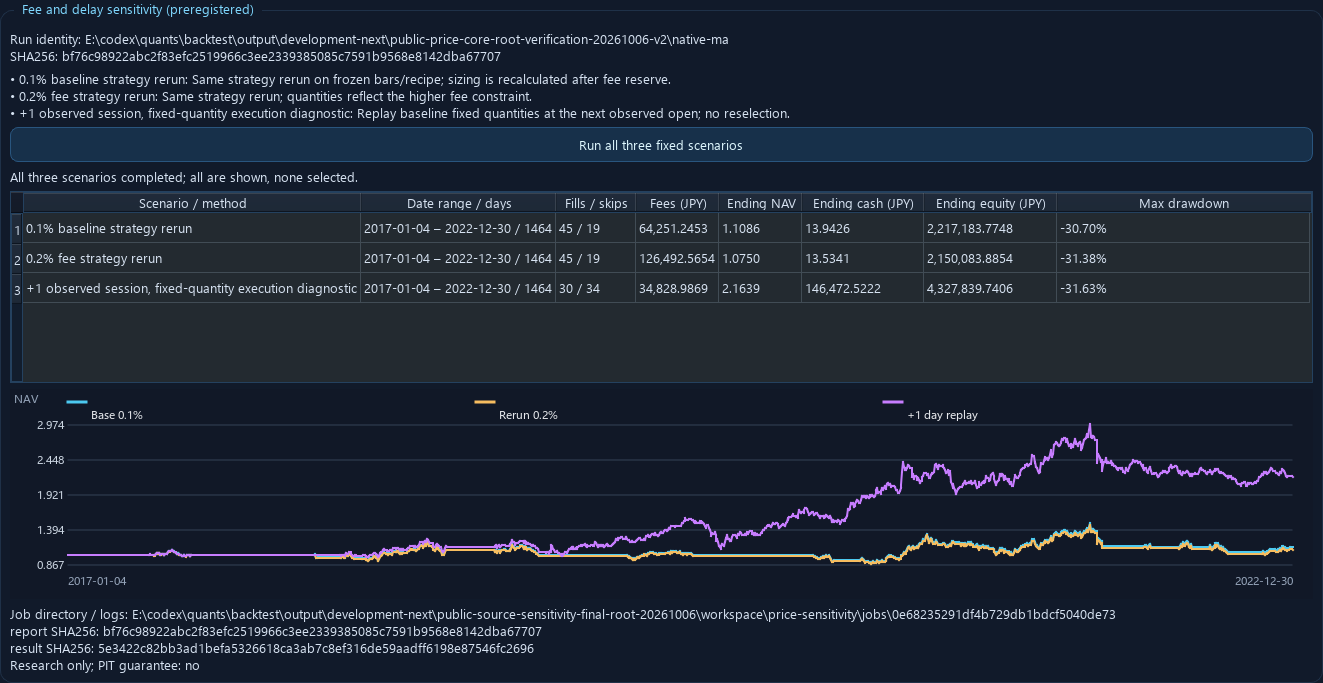
The result contains three rows and three NAV curves. The 0.1% case reruns the fixed recipe. The 0.2% case reruns the same strategy and bars with a higher fee, recalculating prior-close order quantities. “+1 observed session” keeps baseline quantities fixed and executes at the next actual observed open; it is an execution-timing diagnostic, not a new signal/selection or a strategy to prefer.
All cases cover 2017-01-04 through 2022-12-30 (1,464 observations).
| Fixed source | Scenario | Orders | Fills/skips | Fees JPY | Ending NAV | Ending cash/equity JPY | Max drawdown |
|---|---|---|---|---|---|---|---|
| Native MA | 0.1% baseline | 64 | 45/19 | 64,251.25 | 1.10859189 | 13.94/2,217,183.77 | -30.70% |
| Native MA | 0.2% rerun | 64 | 45/19 | 126,492.57 | 1.07504194 | 13.53/2,150,083.89 | -31.38% |
| Native MA | +1 session, fixed quantity | 64 | 30/34 | 34,828.99 | 2.16391987 | 146,472.52/4,327,839.74 | -31.63% |
| TA-Lib MA | 0.1% baseline | 64 | 45/19 | 64,251.25 | 1.10859189 | 13.94/2,217,183.77 | -30.70% |
| TA-Lib MA | 0.2% rerun | 64 | 45/19 | 126,492.57 | 1.07504194 | 13.53/2,150,083.89 | -31.38% |
| TA-Lib MA | +1 session, fixed quantity | 64 | 30/34 | 34,828.99 | 2.16391987 | 146,472.52/4,327,839.74 | -31.63% |
| Price momentum | 0.1% baseline | 183 | 161/22 | 92,328.74 | 1.38670855 | 1,276,821.14/2,773,417.11 | -33.10% |
| Price momentum | 0.2% rerun | 184 | 168/16 | 182,846.64 | 1.25358260 | 9,737.31/2,507,165.19 | -41.32% |
| Price momentum | +1 session, fixed quantity | 183 | 128/55 | 59,240.38 | 1.32007157 | 192,816.23/2,640,143.15 | -38.01% |
Native MA and TA-Lib MA have identical financial paths across the three scenarios for this fixed input. Do not prefer the delayed case because its ending NAV appears higher. Check all three rows and curves, fees, fills/skips, ending values, and drawdowns.
The private task records request/source hashes and worker launch/result/exit logs; the public evidence summary gives the comparison without publishing daily JSON. Monetary figures are displayed to two decimal places; compare the bound report/account path rather than rounded display.
Applies to: main source candidate (unpublished) · Public source docs/en_US/GUI_RESEARCH_COURSES.md
Reviewed · KabuForge